[LS3-3] Variation Statistics
This standard focuses on measuring and estimating different kinds of variation – genetic and environmental – using tools of statistics.
Resources for this Standard:
Here’s the Actual Standard:
Apply concepts of statistics and probability to explain the variation and distribution of expressed traits in a population.
Standard Breakdown
This standard essentially addresses Hardy-Weinberg Equilibrium and other models of variation used to estimate and analyze genetic traits in various populations. While the assessment boundary on this topic excludes specific calculations (see below for more), this subject can be addressed from both a mathematical and conceptual approach.
Punnett Square
A Punnett square is a simple statistics tool used to analyze the assumed genetic outcome of a cross between two parent organisms. Since we know that the process of meiosis separates the two alleles each parent has into separate alleles, the Punnett square allows us to statistically analyze what variation we can expect in the offspring of a cross. For example, in the Punnett square below we can see the probable outcome of a cross between two parents, each with the heterozygous genotype of “Bb” :
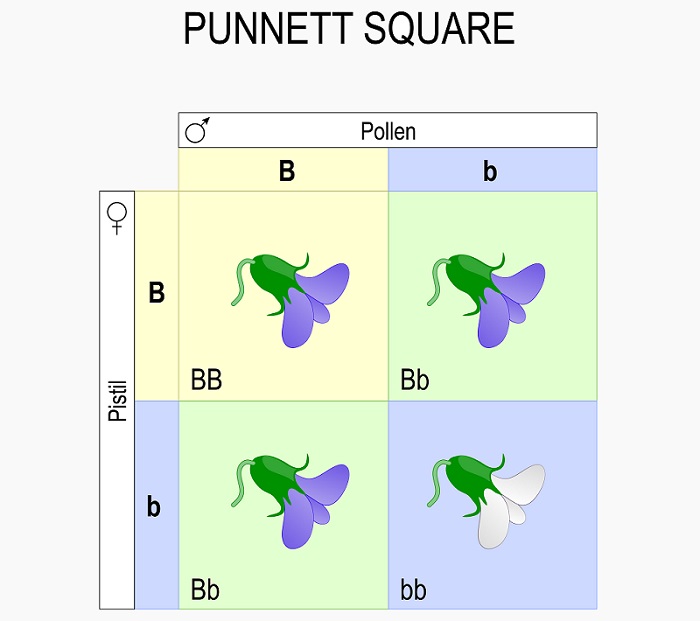
While these two individuals can create many more offspring than the 4 boxes seen, these are the only potential combinations that they can create. Further, the ratios of phenotypes and genotypes seen in the Punnett square will likely be very close to the actual measures genotypes and phenotypes in a population. For example, in the case above there is a ratio of 3:1 purple:white flowers. This phenotypic ratio will extend to all the offspring. Likewise, the genotypic ratio of 1:2:1 will also extend to all the offspring produced from this cross.
Punnett squares are not limited to a monohybrid cross (1 trait). In fact, you can analyze multiple genes simply by adding boxes to the top of the Punnett square. However, beyond 3 traits it becomes hard to calculate the ratios of genotypes and phenotypes by hand.
Allele Frequency
Allele frequency is a common method of analyzing and describing the variation and diversity of alleles within a population. Every species carries a standard set of genes (in theory). Though the genes are largely the same when you measure each nucleotide, small changes can cause major changes in protein function. Observing and estimating changes in allele frequencies over time is what allows scientists to document evidence of evolution within DNA.
Theoretically, this concept is simple – you take the total number of a specific allele, and divide by the total number of alleles for a specific gene in the population. In other words, allele frequency is answering the question, If you took all the alleles for a specific gene in a population (like flower color) and put them in a pot, then randomly drew out just one allele, what is the chance it would be a specific allele (such as the recessive white allele)?
Observing allele frequencies over time can tell us how evolutionary forces are working on the various alleles. If we see the allele frequency of white flowers decreasing over time, it can be assumed that some sort of natural selecting is selecting against the allele, which may just push it to lower levels – or could even make the allele extinct in a population if the selective pressure is strong enough.
Here’s the actual formula for calculating allele frequency in a population:
“X” allele frequency = # of X alleles in population / total # of other possible alleles
Where X is any allele for a specific gene, and the “total” # of other alleles possible refers to other alleles within the same gene. This essentially measures the variability each allele adds to the population of a whole. As such, all the allele frequencies for a gene within a population will add up to 1. However, in practice this is a little harder to measure because it’s hard to understand which genetic variants may contribute to which alleles and ultimate phenotypic traits.
Hardy-Weinberg Equilibrium
Hardy-Weinberg Equilibrium is a kind of model that is used to “test” how allele frequencies are changing within a living population. The Hardy-Weinberg math is based on the genetic possibilities shown by a simple Punnett Square:
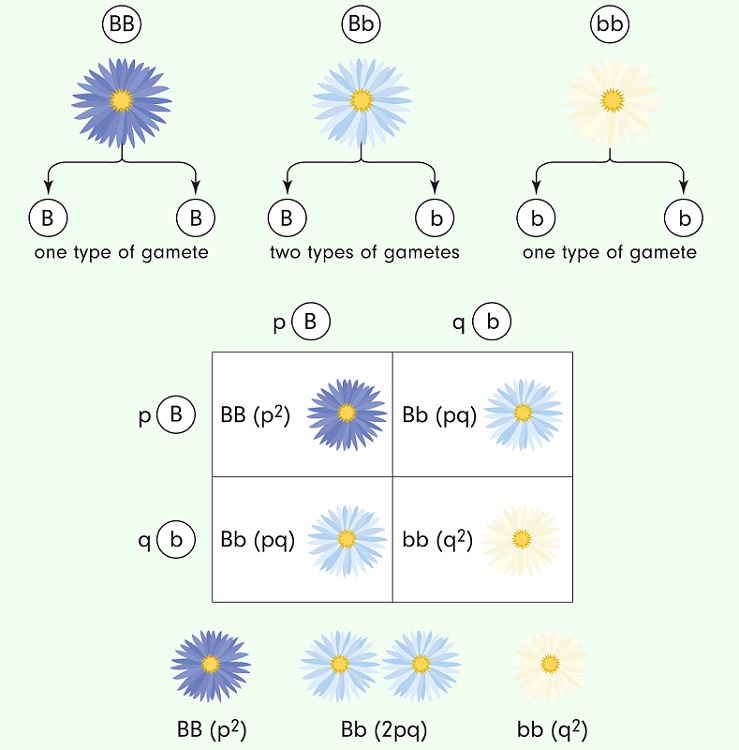
In a system with only two alleles, such as the one above, the math is relatively simple to show how allele frequencies remain the same in a population without natural selection or any sort of migration. In other words, the Hardy-Weinberg model assumes that the population is at a genetic equilibrium and that there are only two active alleles. The Hardy-Weinberg equation can be used to estimate allele frequencies based on actual measurements of the phenotypes in a population. Here are the actual equations:
p + q = 1
p2 + 2pq + q2 = 1
Where “p” and “q” represent the allele frequencies of each allele. The term p2 identifies the homozygous dominant offspring, the term 2pq is for the heterozygous offspring, and the term q2 identifies the homozygous recessive offspring (in a classic dominant/recessive relationship, though it can be used to analyze alleles with any form of dominance).
A little clarification:
The standard contains this clarification statement:
Emphasis is on the use of mathematics to describe the probability of traits as it relates to genetic and environmental factors in the expression of traits.
Let’s look at this clarification a little closer:
Using Mathematics to Describe Trait Probability
This standard really focuses on the mathematical tools we can use to show, classify, and analyze the variation within a population. There are many routes that can be explored here, from analyzing basic crosses in a simple population to discussing the process of allele fixation within a population through the forces of natural selection.
Having students predict and reverse engineer a Punnett square to find answers or genotype a parental generation is a great place to start. By calculating simply genotypic and phenotypic ratios, students can easily see how the power of statistics can be used to predict offspring. It is important to note that genotypic ratios are often much different than phenotypic ratios, a function of the hidden recessive alleles carried in a population. This adds diversity (and sometimes hides genetic disease) within all sexually reproducing populations.
Allele frequencies are a natural step beyond this. Then, you can look at Hardy-Weinberg equilibrium and how we can use it to show that natural populations are evolving. Finally, you can start to look at more than 2 alleles in a population and how certain alleles under strong selection can become fixed in a population or go extinct.
What to Avoid
This NGSS standard also contains the following Assessment Boundary:
Assessment does not include Hardy-Weinberg calculations.
Here’s a little more specificity on what that means:
Hardy-Weinberg Calculation:
While the assessment for this standard does not cover complex mathematical calculations, this is a great tie-in with any algebra classes exploring exponents. By giving students an allele frequency of either p or q, the other allele frequency can be found. For a more difficult challenge, you can give students the number of homozygous recessive individuals and the total number of individuals, and have them calculate the allele frequencies within the population.
While these calculations can be made, they should not be assessed for this standard.