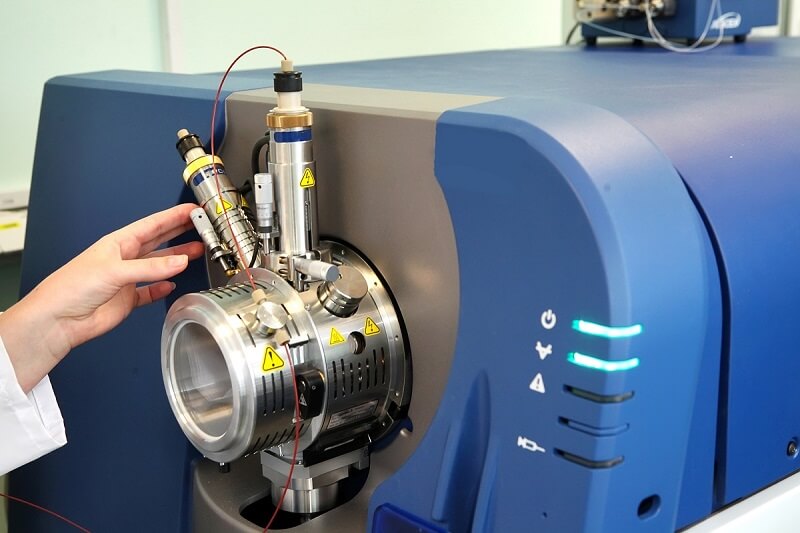
What is Mass Spectrometry?
Mass spectrometry is a tool used to quickly analyze the molecular composition of a sample, helping scientists determine the chemical structure. The process has several steps which serve to break the molecules apart and differentiate their size and charge.
Overview
First, the procedure starts by vaporizing and ionizing a sample. This is most often completed using heat and a beam of electrons. Then, magnetic fields direct the sample towards a detector. Small particles bend more along the curved path. Finally, the sample hits the detector. The computer attached to the detector will print a graph. This graph shows which chemical species were most abundant, based on their mass to charge ratio (m/z).
Many fields of science use mass spectrometry to analyze unknown substances. From the data, the chemical formula and structure of unknown molecules can be determined. In addition, high-resolution mass spectrometry, which contains the most advanced ionization and detection equipment, can accurately determine the formula and structure of almost any compound. Further, mass spectrometry is used not only in sciences such as chemistry and biology to identify substances, but also in criminal forensics, to identify almost any substance encountered.
How Mass Spectrometry Works
The following steps represent how typical mass spectrometry machines work. You can see below for other proceedures which are similar to mass spectrometry.
Ionization of the Sample
The first process of mass spectrometry is ionization. The magnetic field only influences charged molecules, which must first be created. To create ions, though, the substance must first be vaporized. Then, the sample is placed within a chamber of the mass spectrometer. Vapor is created when the chamber is heated.
This vapor will eventually move through an electric field, through which electrons are passing. This process actively creates ions from the sample. However, ions can also be created using chemical methods. Sometimes, the removal and redistribution of electrons cause different species of the molecule to form. These are fractions of the original molecule. These will be seen on the final output from mass spectrometry, and give vital clues to the structure of a molecule. Finally, the ionic vapor is ready to be accelerated and analyzed.
Sorting the Ions
After ionization, the ions accelerate quickly between two negative plates. It is possible to detect positive cations, though the negative ions leave via the vacuum tube. Then, the positive ions travel down a curved tube. In order to bend the path of the ions, a large electromagnet encircles the tube. Further, varying the voltage to the magnet helps “aim” the molecules to the end of the tube. An output screen on the device will detect will display a graph, showing the abundance and mass/charge ratio of each fragment.
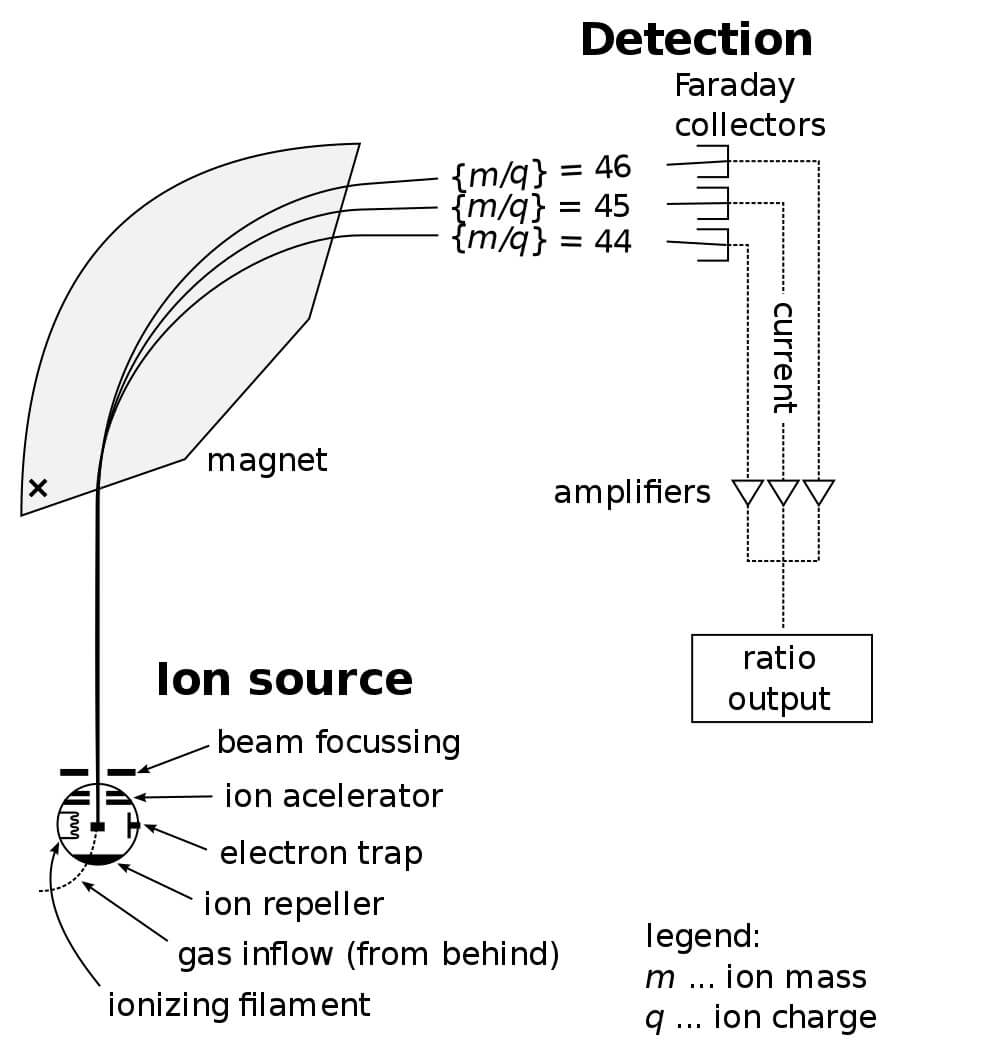
In light of the slit being so small, and the power must be exactly right to get a particle to curve just right and exit the slit. Larger molecules will tend to curve less than small molecules. Concurrently, the computer graphs the output at each level, which corresponds the mass to charge ratio of the molecules at each level. Only molecules of a certain size and charge can get through the slit at any given level of power.
Then, the computer senses the total amount of molecules that make it through the slit. This allows the operator to effectively sort and analyze the entirety of any sample by processing it through mass spectroscopy. However, because the molecules must be ionized, there are also fractional species produced. This can aid in identifying the structure of the molecule, but it can also make identification vastly more complicated. Some molecules can produce dozens of different peaks as they break apart!
Detecting the Ions
Finally, the sensitive screen beyond the slit detects these molecules as they flow through. The computer analyzing this screen tracks their relative abundance at each mass to charge ratio. Eventually, it will display the results as a graph, similar to the one below of carbon dioxide.
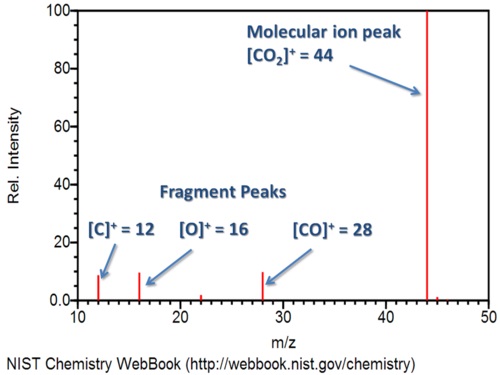
Note that the most abundant species is the carbon dioxide cation, or the positive molecular ion. Carbon dioxide losing 1 electron forms this ionic species. The process also creates other fragments. For example, you can see the peaks for carbon monoxide, oxygen, and carbon cations. These correspond to their molecular weights, and the strength of the bonds in the original molecule determines how easily fragments are created and how abundant they will be.
How to Read Mass Spectrometry
Mass spectrometry is analyzed by studying the graph created by the mass spectrometer. In general, the machine will produce a graph with several bars. The tallest bar will reach the top of the graph. In this case, this was the most abundant species and everything else is compared in abundance to this main species. The mass to charge ratio of this species can roughly tell you the molecular weight of the original molecule.
The peaks can tell you a lot about the molecule. The base peak is the most abundant and also represents the most stable species formed after the sample is ionized. Take, for instance, the following analysis of the mass spectrometry of hexanal. You can see the chemical structure of this molecule imposed on the graph of mass to charge ratio versus abundance below.
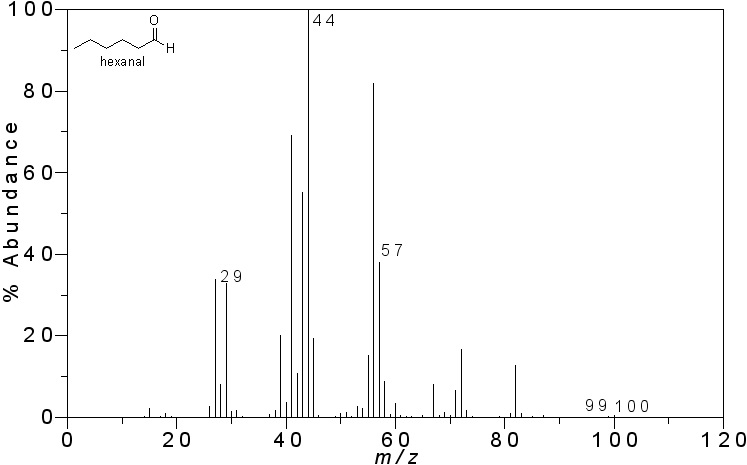
First, notice the base peak, at 44 m/z. This molecular fraction has a molecular weight of 44 atomic units. The highest bar created is at 100 units. This represents the most complete version of the molecule, telling us the weight of the entire molecule. If we add all the molecules in hexanal (C6H12O), we will find it does indeed have an atomic mass of 100.
Second, the peak at 44 represents a fraction of the molecule created by the oxygen, two carbons, and two of the hydrogens. Finally, the peak at 57 represents a larger portion of the carbons attached. Thus, the strong electronegativity of the oxygen double bonded to the carbon makes it a highly stable species, making it the most relatively abundant ion. All of these clues in the graph can lead us to the conclusion that our sample contained hexanal.
Lab Techniques Like Mass Spectrometry
Below are several other lab techniques similar to regular mass spectrometry:
- Gas Chromatography – A technique that mixes an unknown sample with various gasses and flows the gas over a detector. It can be used to separate substances or identify unknown molecules.
- Liquid Chromatography – Similar to gas chromatography, only a liquid is used. Different absorbent materials collect different parts of the sample, which can then be measured or analyzed using another technique. Great for separating a mixed substance.
- Secondary Ion Mass Spectrometry – A version of mass spectrometry that is used to analyze solid surfaces and thin films. Ions are shot at the surface, and the resulting secondary ions that form are used to determine the material’s properties.
- Tandem Mass Spectrometry – Commonly used to identify proteins and biological molecules, this process uses two mass spectrometry machines in sequence to ionize a sample, then break it down further for even better analysis.
- Inductively Coupled Plasma Mass Spectrometry – Using a different method to vaporize the sample allows this type of mass spectrometry to be very sensitive to small amounts of metals within a sample, making it useful for water quality analysis.
Quiz
Bibliography
Bruice, P. Y. (2011). Organic chemistry (6th ed). Boston: Prentice-Hall.
Lodish, H. F. (Ed.). (2008). Molecular cell biology (6th ed). New York: W.H. Freeman.
Silberberg, M. S., & Weberg, E. B. (2009). Chemistry: the molecular nature of matter and change (5th ed). Boston: McGraw-Hill.