[LS2-2] Factors Affecting Biodiversity and Populations
This standard focuses on how various factors affect biodiversity and populations within an ecosystem, and how we can analyze and discover these factors mathematically.
Resources for this Standard:
Here’s the Actual Standard:
Use mathematical representations to support and revise explanations based on evidence about factors affecting biodiversity and populations in ecosystems of different scales.
Standard Breakdown
There are several standard mathematical representations that can be studied to find factors that affect biodiversity and ecosystems:
Abiotic Factors:
Abiotic factors are non-living things within an environment that can affect the carrying capacity and ultimately the biodiversity of ecosystems. The easiest of these abiotic factors to analyze mathematically is rainfall, since accurate measurements of rainfall are easy to find for ecosystems around the globe. By creating a histogram of rainfall in different ecosystems and how many species those places hold, students can see how rainfall helps primary producers grow, thereby promoting a larger amount of biodiversity.
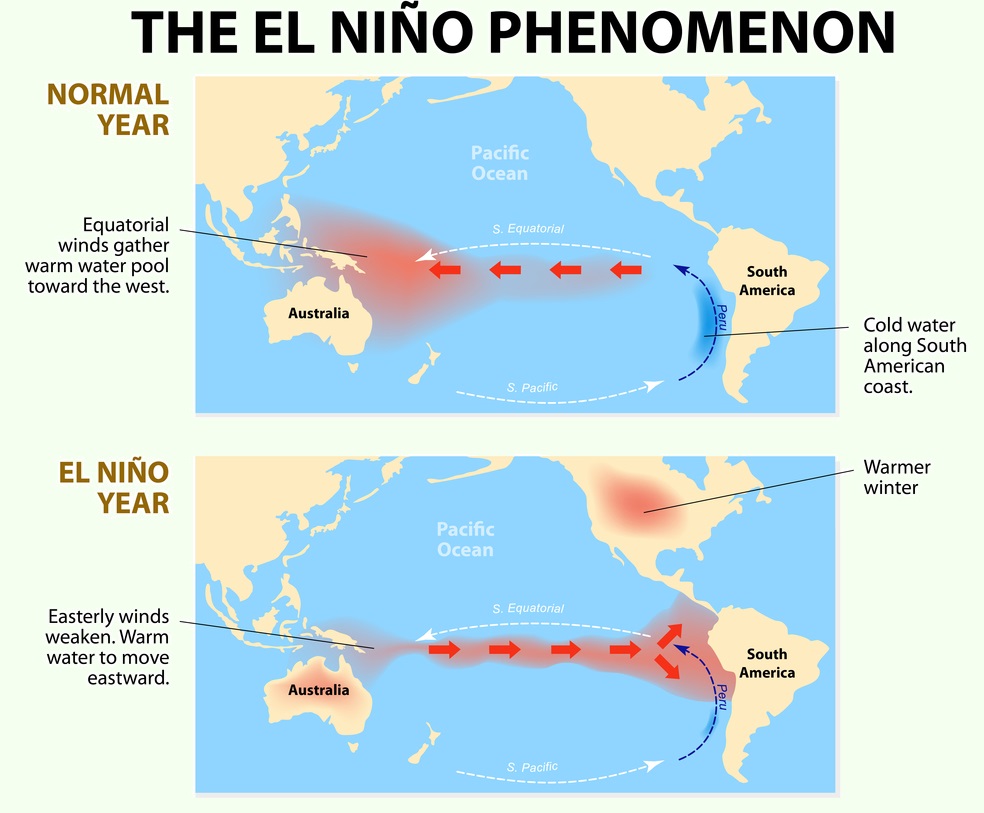
Advanced analysis can look at El Nino weather patterns and students can estimate how these changes in ocean currents may affect rainfall in different ecosystems – and therefore may affect biodiversity.
However, there are many other modern phenomena that can be studied – such as the effect of plastics on ocean populations, carbon emissions on global environments, and other human pollution and environmental interactions that can decrease biodiversity.
Biotic Factors:
Biotic factors include interactions between organisms in an ecosystem. Biotic factors including things like predation, competition, and other species-level interactions that lead to increases or decreases of biodiversity.
For example, the loss of a primary producer can drastically change the biodiversity within an ecosystem. Because the entire food web gets it energy from primary producers, any disruption in the production of plants can create massive swings in biodiversity. These disruptions can come from too many herbivores, a disease in the plant population, or abiotic changes in weather or nutrients. Some great graphs are available online of predator-prey dynamics and carrying capacity that can be used to show the interaction of different organisms.
A little clarification:
The standard contains this clarification statement:
Examples of mathematical representations include finding the average, determining trends, and using graphical comparisons of multiple sets of data.
Let’s look at this clarification a little closer:
Mathematical Representations:
Population dynamics and size is a field almost entirely based in mathematics. Beyond the representations included in the clarification statement, teachers can also explore exponential growth of populations, how limiting factors hinder that growth, and “K” or “r”-selected growth patterns of different species. Advanced students can begin to look at how various factors contribute to the change of alleles within a population, extinction, and speciation.
What to Avoid
This NGSS standard also contains the following Assessment Boundary:
Assessment is limited to provided data.
Here’s a little more specificity on what that means:
Provided Data:
The assessment boundary here essentially limits assessments to common data sets that are provided by the teacher. However, collecting and interpreting your own data is a cornerstone of biological science, and should be provided through other activities. See our teaching resources for some ideas!