
Cladogram Definition
A cladogram is a diagram used to represent a hypothetical relationship between groups of animals, called a phylogeny. A cladogram is used by a scientist studying phylogenetic systematics to visualize the groups of organisms being compared, how they are related, and their most common ancestors. A cladogram can be simple, comparing only two or three groups of organisms, or it can be enormously complex and contain all the known forms of life.
Cladogram design is universal, although simple. A cladogram consists of the organisms being studied, lines, and nodes where those lines cross. The lines represent evolutionary time, or a series of organisms that lead to the population it connects to. Nodes represent common ancestors between species. At some point in the past a population of common ancestor organisms was divided, giving rise to the different organisms being studied. Some cladograms show evolutionary time through the scale of the lines, longer lines meaning more time. Some cladograms chose to show extinct species, while others omit them. Any particular cladogram is formulated specifically for the use it is needed.
A cladogram gets its name from the clades, or groups of organisms that are displayed. A clade is a group of living organisms and the common ancestor they are derived from. Scientist use synapomophies, or shared derived characters, to define these groups. For instance, mammary glands are a shared characteristic of mammals. All mammals and their oldest common ancestor, had or have mammary glands. Thus, if we are looking at an unidentified animal and trying to place it in a cladogram, if it has mammary glands we know it belongs in that branch. Symplesiomorphies, by contrast, are characters that all organisms in the cladogram have. If the cladogram including the mammals was of all vertebrates, then the presence of vertebrae in our unknown animal would be a symplesiomorphy. Symplesiomorphies do not tell us anything about the relatedness of different groups in a cladogram, because all the organisms have (or had), that characteristic. A very simple cladogram of the vertebrates can be seen below.

Scientists use cladograms to propose and ask questions about the evolutionary relationships between different species. By giving weigh to derived characters and recognizing ancestral characteristics, scientists can compare different phylogenies of the same groups of organisms. Some will be very complex, as characters will have to independently arise in multiple lines. Others will be simple, or parsimonious, and will contain fewer changes between groups. Any set of characters can be used to create a cladogram. DNA is the preferred method, as it is incredibly accurate. However, before the days of DNA, scientists created accurate cladograms using a variety of other traits. While the evolutionary relationships between organisms cannot be determined on any one trait, combining the parsimonious results of many different traits will lead to the most probably phylogeny. The cladogram that describes this phylogeny will likely be the most simple and have the fewest nodes.
Examples of Cladogram
Primates
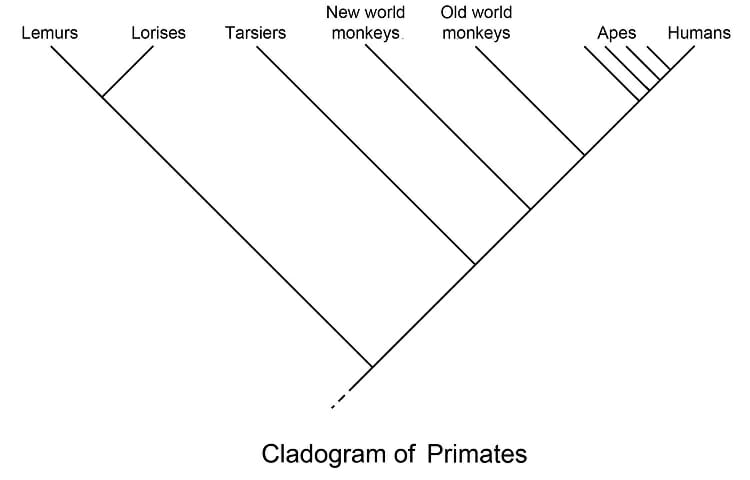
In the above cladogram of Primates, the various groups of primates being compared are listed on the top. The various nodes on the diagram represent the various common ancestors between the groups. The Apes, the group containing humans, and all the common ancestors (nodes) down to the lowest ape are considered a clade, or group of organisms with similar characters due to common descent. The clade could be extended to include everything except the Lemurs, Lorises, and the lowest node. If this were the case, the line leading to lemurs would be considered the outgroup, while the rest of the primates would be considered the ingroup. These terms are simply used to describe different groups when discussing them in scientific writing.
Whales and Related Animals
Below is a much more complicated cladogram of whales and the animals they are related to. Many more groups are represented, down to genus and species in some cases. In this cladogram, bold lines represent living species, while narrow lines represent extinct species from the fossil record. The numbers above each line represent the number of evolutionary changes that had to occur in that branch from the ancestral form.
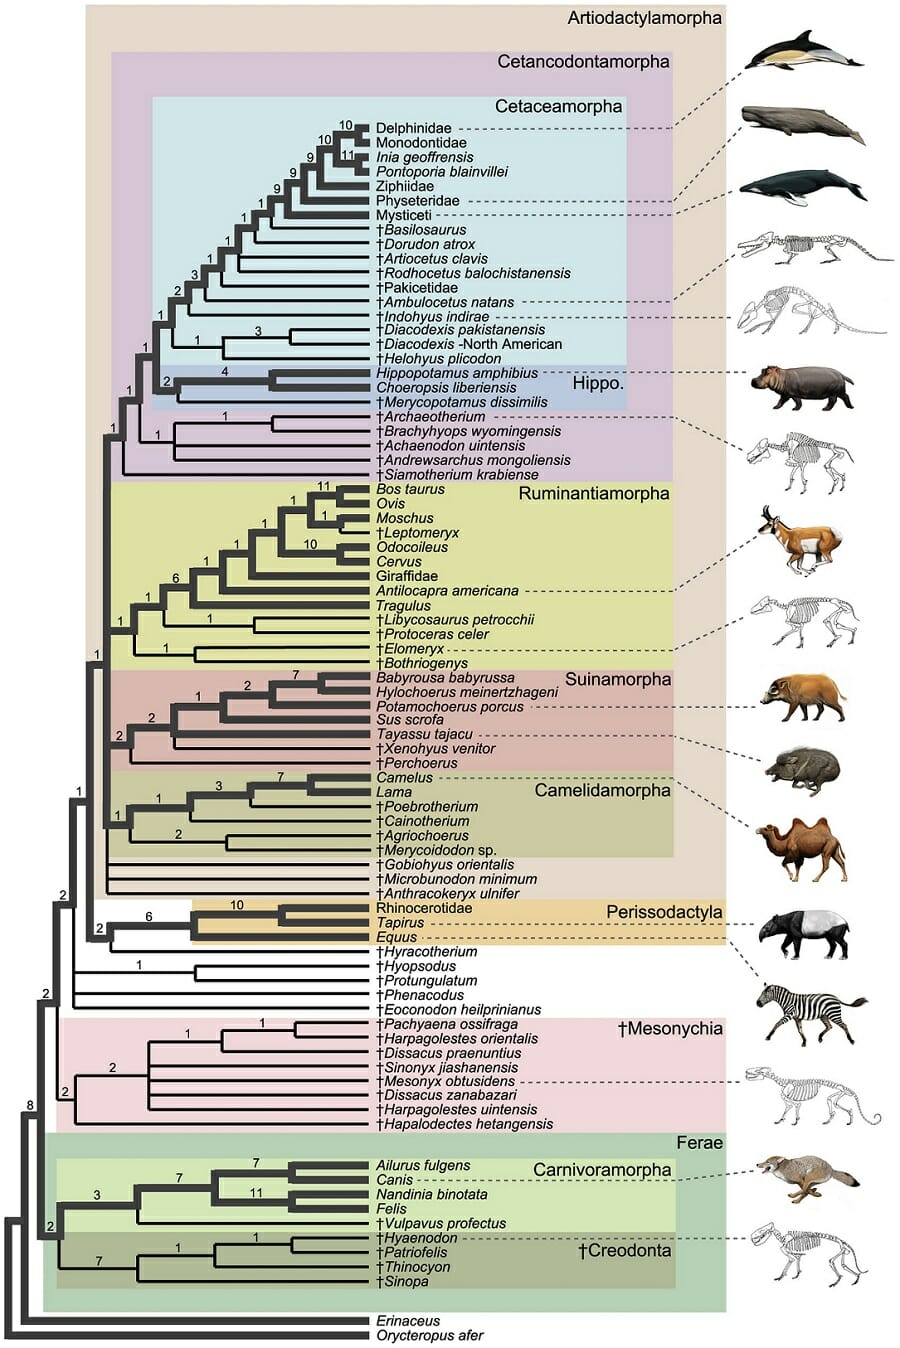
Looking at the top box of Cetaceamorpha, this branch represent Cetaceans (whales and dolphins) and their related ancestors. Until the discovery of the various fossils that bridge the gap between hippos and whales, the phylogeny of this tree was in question. However, these fossils have started to close the gap between hippos and cetaceans, forming a series of small steps. Near the top of the diagram, the number of evolutionary changes jumps from 1 or 2 to 9 or 10 in each step. This represents an evolutionary gap that is still not understood. The ancestral forms of whales and dolphins presented on this cladogram would have been shallow-water animals, as seen by their functional limbs. As the ancestors of whales moved further out to sea, it becomes less and less likely that their fossilized remains will be found.
Many characteristics were considered in the creation of this cladogram. For example, the outgroup Ferae is the only group that does not have some sort of hoof or large toes. In addition, the Ferae have specialized carnivorous teeth. The rest of the groups become distinguished on different derived characters, such as humps in the camels, the presence of a rumen in the Ruminantiaphorpha, and others. Whales are a particularly hard group to hypothesize about, due to the lack of fossil evidence and the vast physiological difference between whales and their closest relatives. Without limbs, for instance, it is impossible to know that whale are related to animals with limbs unless some evidence is found to that effect. Luckily for systematics, new methods of DNA analysis allow scientist to compare DNA directly, leading to a better understanding of how organisms are related and how changes happen between populations.
Interpreting Cladograms
In the following cladograms, it appears as if two different phylogenies are being presented. In the cladogram on the right, it appears that A is more closely related to C than in the cladogram on the left. This is simply a trick of presentation, but represents no meaning in terms of relatedness. These two cladograms do, in fact, represent a single phylogeny.

When creating or reading cladogram, it is important to remember that the only important features of the cladogram are the lines and the nodes. In these two cladograms, the lengths of the lines are roughly the same and more importantly, the nodes are in the same places. In both diagrams, A and B share a node that is further away from the origin of the line in the diagram. This tells us that A and B are more closely related than C is to either group. The order of A and B, as well as the orientation of the lines, does not matter. A cladogram may be drawn left to right, right to left, top to bottom, or bottom to top. Some large cladograms are even fashioned in a circle to include all the groups they represent. In some cladograms, evolutionary time in millions of years is represented to give an approximation from the lengths of the lines.
Related Biology Terms
- Phylogeny – A hypothetical relationship between organisms, represented by a cladogram.
- Symplesiomorphy – A characteristic that all organisms on a cladogram possess.
- Synapomorphy – A characteristic that only a specific group, descended from a common ancestor, possess.
- Homoplasy – A shared character that is shared through convergent evolution, not common decent.
Quiz
1. In the following cladogram, which groups are most closely related?
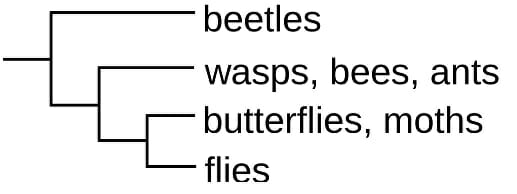
A. Beetles and Ants
B. Flies and Beetles
C. Moths and Flies
2. You are making a cladogram of fruit. You have 4 fruits: a banana, and orange, a red apple, and a green apple. On appearance alone, which of these is an outgroup, and which two belong on the node furthest from the start of the diagram?
A. Orange; Banana and Red Apple
B. Banana; Orange and Red Apple
C. Banana; Red Apple and Green Apple
3. Look at the cladogram referenced in question #1. Which of the following characteristics is a symplesiomorphy of the cladogram?
A. Wings
B. A tongue to gather nectar
C. Wings that fold under a hard shell